

OUR NEWS & BLOG
Monitoring automization with Prometheus and Grafana
6/22/2022, 04:16:23
Open-source based monitoring solutions are on the rise for improving system stability.
Prometheus is a popular option among them. Many companies are now using it as an independent open-source project, and the trending Kubernetes is also encouring monitoring using Prometheus.
Prometheus can be briefly explained as below.
The agent (exporter) is installed on the production server that needs monitoring to enable transferring of metric data using HTTP, and Prometheus collects (pull) that metric information.
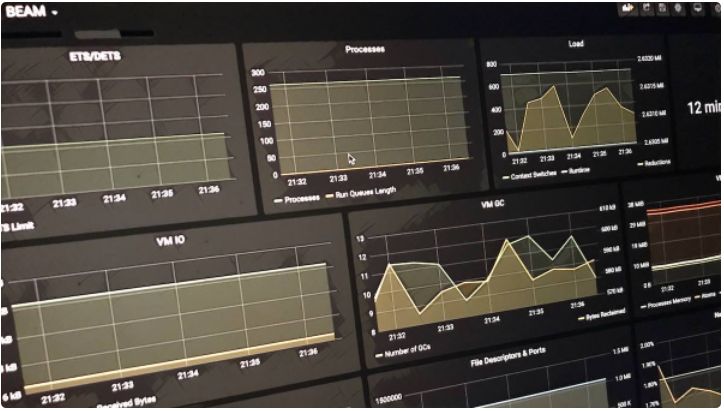
This method does not require the production server to send (push) data, resulting in no burden on the production server. It is also possible to build a web view serving as a dashboard of collected information using a visualization tool called Grafana. What's more, the warning feature that notifies admin of system issues is also easy to use.
At GLOTOSS, we provide system upgrade services that apply Prometheus and Grafana.
If you are concerned about improving your system stability, contact GLOTOSS!